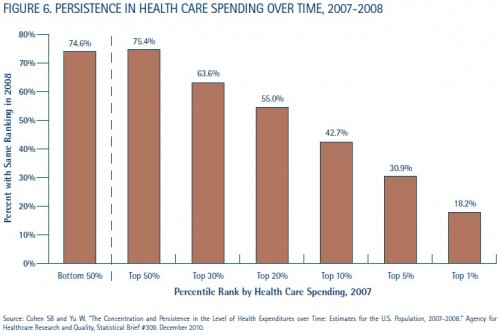
This is the second of two posts based on a new data brief from the National Institute for Health Care Management (and, even with this, I have not exhausted the content of that data brief). In the prior post, I showed their chart on the distribution of health spending. One might wonder how persistent health spending is. If you have high health spending in one year, will it continue to be high in the next?
Actually, yeah, it’s pretty persistent over a two-year span. Three-quarters of individuals below (or above) the median spending level in one year are still below (or above) the median spending level in the next. Over half of individuals in the top 20% of spending in one year remain at that level for another year. Average spending for those in the top 20% is somewhere around $15,000 (crudely interpolating from a chart I showed yesterday). We’re talking pretty big bucks, and not just once, but two years in a row.
The NIHCM data brief explains, “Chronic conditions are also a likely reason why somepeople have high spending over an extended period, particularly when multiple chronic conditions are present.”
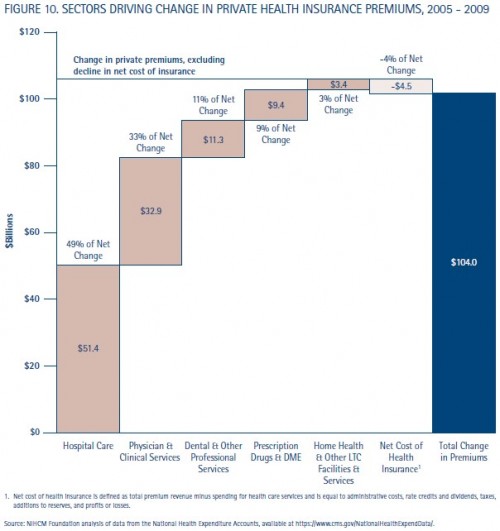
Speaking of how spending changes over time, how about premiums? What health sectors are driving their growth and by how much?
Hospital care is a major driver of premium growth, as are physician and clinical services. Spending on hospital care, or anything, is a product of price and quantity.* Which is growing? It’s largely, but not entirely, price:
[T]he most recent analysis of the National Health Expenditure Accounts data by members of the government team responsible for compiling and analyzing the data found that general inflation and medical price inflation accounted for 60 percent of the change in personal health care spending from 2008 to 2009, while non-price factors were responsible for the remaining 40 percent of spending growth. A PriceWaterhouseCoopers analysis of employersponsored health premium data collected through the Kaiser Family Foundation determined that 75 percent of the 6.1 percent growth in premiums between 2006 and 2007 was due to price factors, and 25 percent was attributable to changes in utilization. Likewise, the analysis of data for the 2011 Milliman Medical Index attributes most of the growth in family medical spending between 2010 and 2011 to increases in average unit price in the inpatient, outpatient, physician, and pharmacy sectors. And an analysis by UnitedHealth Group of its own claims experience for 2009 indicates that unit price pressures – especially for inpatient and outpatient services and some widely prescribed drugs – explained two-thirds of its increased medical costs.
Citations for this section are listed in the NIHCM brief. The brief also covers the factors driving price and utilization growth. Among the many in the area of hospital care, is hospital market consolidation. Cue my post earlier in the week on just that.
* Strictly speaking, total spending is the sum of prices times quantities for each health care product or service. One can get spending increases with no price changes just by shifts in utilization patterns from lower (but static) price products or services to higher (but static) price ones.


