Yesterday, Julie Rovner reported on a new Milliman publication about increasing health care costs. Rovner wrote,
[T]he overall increase in the amount of money required to cover a typical family of four in a preferred provider organization was $1,319 in 2011 — the highest figure in the more than 50 years Milliman has been doing this study.
Who paid the freight? Employers kicked in just under half, or $641, with employees paying the rest either in the form of higher premiums or larger cost-sharing.
And here’s a little more bad news. Since 2002, the total cost to American families for their health care has more than doubled to $19,393 from $9,235.
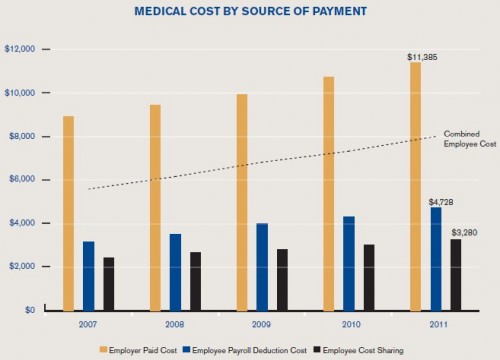
The Milliman report (ungated) includes many graphs. Among them is this one that breaks employer-based health care costs into contributions made by employers and employees, including time-of-service cost-sharing.
This figure is a complete picture of evolution of “skin in the game” for a typical family of four in a PPO. In 2011, employers paid an average of $11,385 toward such a family’s health care costs, employees paid $4,728 toward the premium and another $3,280 in cost-sharing.* In percentage terms, of the total cost of $19,393 (=$11,385 + $4,728 + $3,280), employees pay 17% in cost-sharing and 24% in premium contributions, for a total of 41%. This figure is a bit higher than it has been in the recent past. In 2007, employees contributed 38% toward health care costs. In 2002, the figure was 39%. Though the percent of employee contributions hasn’t grown much, the base has.
* In truth, employees pay the full cost of their health care. Employer costs are offset by lower wages.


