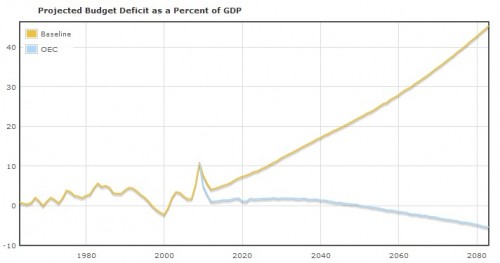
In preparation for that talk I’m giving, here are some graphs I’m considering using as motivation. Click to enlarge any of them. This first figure illustrates what will happen to the budget deficit if we continue along current trend in our health care spending (yellow line) vs. adopt (somehow) a rate of spending increase equal to that of OECD countries (blue line). The figure is from the Health Care Budget Deficit Calculator, produced by the Center for Economic and Policy Research.
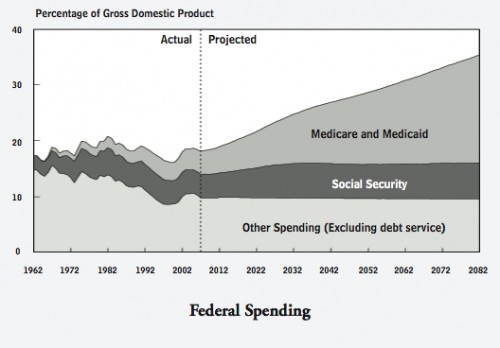
Much of that projected increase in spending is Medicare + Medicaid. See the next figure (from the Tax Policy Center, though I believe it originates from the CBO). This doesn’t even count tax subsidies and other government health spending (VA, military, etc). Try not to let that Social Security band in the graph distract you!
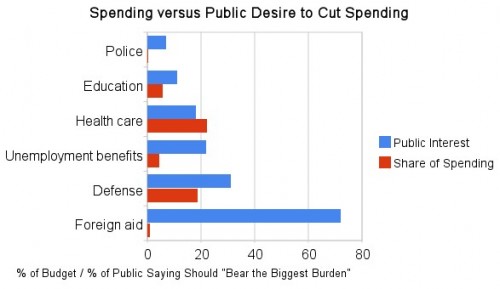
And yet, Americans are mostly interested in cutting spending in other areas, like foreign aid. And this is after a year-long public dialog on health care and its cost. How much sense does this make? See the next figure (source: Ezra Klein via Bruce Bartlett via Harris).
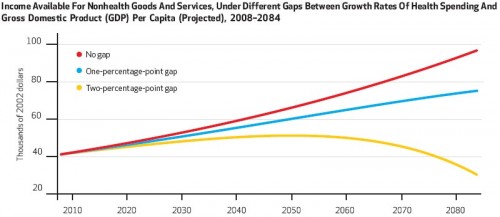
What happens if we don’t rein in spending? The following (from Joe Newhouse) tells the frightening tale. If health spending increases at just 2 percentage points above GDP (which is low by historical standards), government spending on non-health goods and services must plummet (yellow line) unless we increase taxes or take on more debt. Taxes would have to more than double to keep up.
Debt levels are already high and headed into the stratosphere. Here’s a nice historical graph of debt from the CBO.
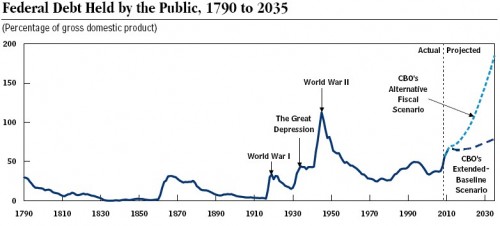
Just in case you’re wondering, CBO’s “alternative fiscal scenario” (the mortifying dotted blue line projection) is not based on anything terribly radical.
CBO also developed an alternative fiscal scenario, in which most of the tax cuts originally enacted in 2001 and 2003 are extended (rather than allowed to expire at the end of this year as scheduled under current law); the alternative minimum tax is indexed for inflation (halting its growing reach under current law); Medicare’s payments to physicians rise over time (which would not happen under current law); tax law evolves in the long run so that tax revenues remain at about 19 percent of GDP; and some other aspects of current law are adjusted in coming years.
Bottom line: government and its services run on money. We can’t expect to extract too much more (some more yes, but not too much more) from taxation and debt. Health care is consuming government budgets (federal and state) at an accelerating rate. Are we interested in government doing anything else? If so, the rate of health care spending increases must come down.
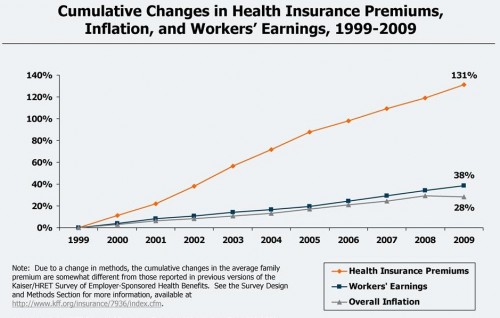
Oh, and finally, this is not just a government problem. Private costs are increasing just as fast and, no, incomes are not keeping up, as shown below (source: Kaiser Family Foundation).
