From the new Commonwealth Fund document by Sherry Glied and Stephanie Ma:
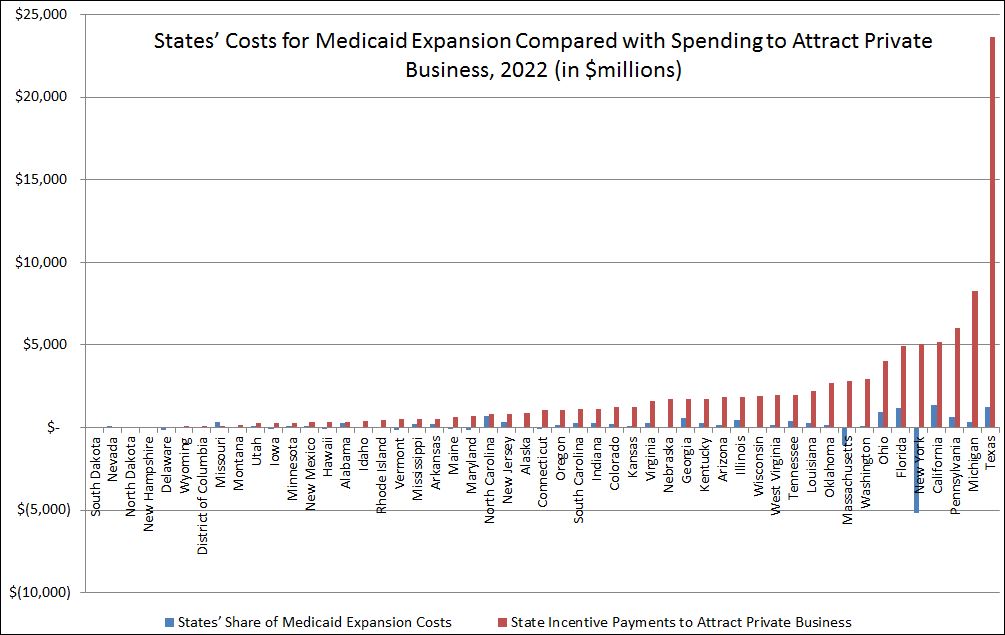
One way to look at these state payments [for Medicaid expansion] is to compare them with other efforts to attract investments to the state. In Exhibit 3 [see below], we compare the states’ costs with average annual state expenditures to attract private businesses, such as tax breaks provided to companies. On average, the states’ costs in 2022 will be less than one-sixth the amount they pay out annually to attract private businesses.
Exhibit 3 in the document is a table. Below is the data in a chart, sorted from lowest to highest state spending to attract private business (click to enlarge). The footnote in the document says, “States with negative dollar amounts [] have previously expanded eligibility for their Medicaid programs prior to the enactment of the Affordable Care Act. These states will get enhanced matches on the expansion populations; thus, their total spending will fall.” Also, the data are obviously not from 2022, but the values are trended forward to 2022 using the consumer price index. (I don’t know why the authors did that, but it doesn’t change the basic story.) You can read the document for additional details.