
This is a guest blog post authored by Paul Shafer, MA; Erika Franklin Fowler, PhD; Laura Baum, MURP; and Sarah Gollust, PhD. Paul Shafer is a PhD student at the University of North Carolina and a Robert Wood Johnson Foundation Health Policy Research Scholar. Erika Franklin Fowler is Associate Professor of Government at Wesleyan University and co-director of the Wesleyan Media Project. Laura Baum is the project manager for the Wesleyan Media Project. Sarah Gollust is an associate professor in the Division of Health Policy and Management at the University of Minnesota School of Public Health and the associate director of RWJF’s Interdisciplinary Research Leaders program. You can follow the authors on Twitter at @shaferpr, @efranklinfowler, @wesmediaproject, and @sarahgollust.
The Trump administration announced Thursday that it was cutting spending on advertising for the 2018 Marketplace open enrollment period from $100 to $10 million. Empirical work can inform our expectations for its impact, assuming these cuts are implemented. We already know that higher exposure to advertising has been associated with perceptions of feeling more informed about the ACA and counties with more television advertising saw larger decreases in the uninsured rate during the 2014 open enrollment period.
Kentucky— an early success story under the ACA—sponsored a robust multimedia campaign to create awareness about its state-based marketplace, known as kynect, to educate its residents about the opportunity to gain coverage. However, after the 2015 gubernatorial election, the Bevin administration declined to renew the advertising contract for kynect and directed all pending advertisements to be canceled with approximately six weeks remaining in the 2016 open enrollment period. The reduction in advertising during open enrollment gives us precisely the rare leverage needed to assess the influence of advertising using real-world data.
We obtained advertising and Marketplace data in Kentucky to identify whether a dose-response relationship exists between weekly advertising volume and information-seeking behavior. Television advertising data for Kentucky were obtained from Kantar Media/CMAG through the Wesleyan Media Project. These data provide tracking of individual ad airings, including date, time, sponsor, station, and media market. We used a population-weighted average to create a state-level count of kynect ads shown per week. Our outcome measures were related to information-seeking behavior—phone calls to the marketplace and metrics related to engagement on the kynect website—and came from the Office of the Kentucky Health Benefit Exchange via public records request. We used multivariable linear regression models to identify variation in each outcome attributable to kynect advertising and estimated marginal effects to identify the influence of advertising during open enrollment.
FIGURE 1: Weekly advertising and information-seeking behavior in Kentucky, Oct. 1, 2013–Jan. 31, 2016
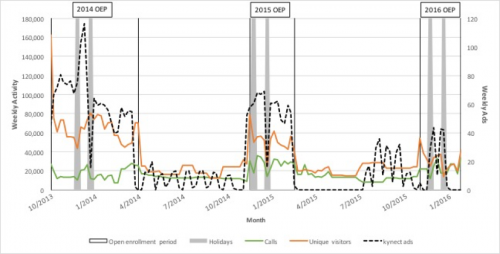
† OEP=open enrollment period, Holidays=weeks of Thanksgiving and Christmas
State-sponsored advertising for kynect fell from an average of 58.8 and 52.3 ads per week during the 2014 and 2015 open enrollment periods to 19.4 during the first nine weeks of the 2016 open enrollment period and none during the final four weeks. We found that advertising volume was strongly associated with information-seeking behavior through the kynect web site (see Figure 1). Each additional kynect ad per week during open enrollment was associated with an additional 7,973 page views (P=.001), 390 visits (P=.003), and 388 unique visitors (P<.001) to the kynect web site per week. Based on the average number of ads per week during the first two open enrollment periods, our estimates imply that there would have been more than 450,000 fewer page views, 20,000 fewer visits, and 20,000 fewer unique visitors per week during open enrollment without the television campaign. Advertising volume during open enrollment was not associated with calls to the kynect call center.
TABLE 1. Multivariable linear regression models for kynect advertising on weekly information-seeking behavior in Kentucky, Oct. 1, 2013–Jan. 31, 2016

* P<.05, ** P<.01
† Models also control for weekly advertising volume for other five sponsor types (healthcare.gov, insurers, insurance agencies, nonprofits, other state governments), their interaction with the open enrollment indicator, and number of days in the reporting period.
Our analysis tells us that state-sponsored television advertising was a substantial driver of information-seeking behavior in Kentucky during open enrollment––a critical step to getting consumers to shop for plans, understand their eligibility for premium tax credits or Medicaid, and enroll in coverage. Extrapolating to the national landscape, our data suggest that lower expenditures on outreach and advertising would reduce consumers’ information seeking. The announced 90% reduction will be paired with a nearly 40% cut to in-person enrollment assistance through navigator programs. This is particularly problematic after a tumultuous summer of legislative threats to the ACA, possibly leaving consumers confused about whether Obamacare is still the law of the land. Lower outreach could lead to a failure to engage so-called healthy procrastinators, resulting in weaker enrollment and a worsening risk pool for insurers. With an already shortened open enrollment period, this cascade of cuts is likely to further jeopardize the stability of the Marketplace.